National Home Sales Continue to Climb
Canada’s real estate market is gathering steam, with home sales posting their best August performance in four years. According to a recent report from the Canadian Real Estate Association (CREA), sales across the country increased by 1.1% from July to August 2025. This marks the fifth consecutive month of growth, bringing the total increase in activity to 12.5% since March.
While past months saw gains dominated by the Greater Toronto Area, August’s growth was driven by other major centres like Montreal, Greater Vancouver, and Ottawa. This sustained upward trend suggests a broader recovery in housing activity across the nation.
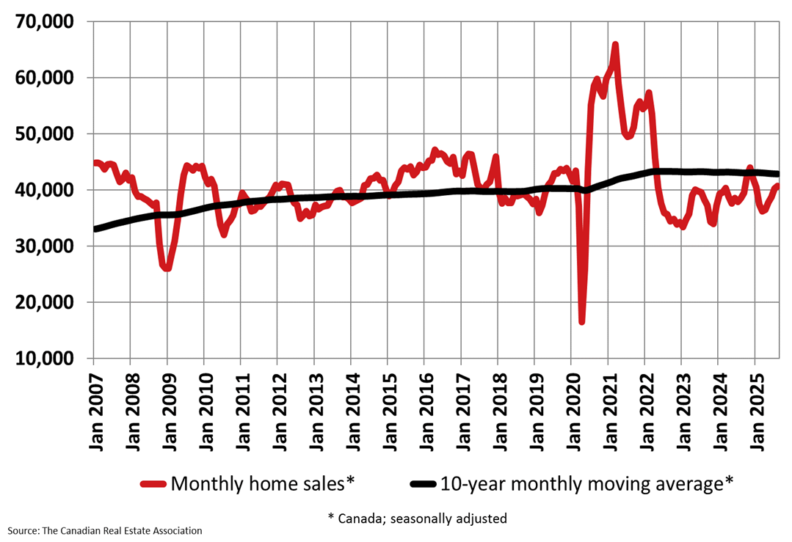
Chart showing Canadian home sales. Source: The Canadian Real Estate Association (CREA)
What’s Driving the Market?
More homes are hitting the market, with new listings rising 2.6% in August. This increase in supply provides more options for homebuyers. The national sales-to-new-listings ratio, a measure of market balance, sits at 51.2%. This figure suggests balanced market conditions, where supply and demand are relatively aligned.
Experts are watching these trends closely as we head into the fall. “Activity has continued to gradually pick up steam over the last five months, but the experience from a year ago suggests that trend could accelerate this fall,” said Shaun Cathcart, CREA’s Senior Economist. He noted that a potential interest rate cut from the Bank of Canada could draw even more buyers into the market.
How Are Prices Responding?
Despite the rise in sales, home prices remain relatively stable. The National Composite MLS® Home Price Index (HPI) was nearly unchanged from July to August, dipping by just 0.1%. Compared to August of last year, the benchmark price is down 3.4%.
However, the national average sale price tells a slightly different story. It reached $664,078 in August, an increase of 1.8% from the same time last year. This shows that while benchmark prices adjust slowly, the average transaction price is starting to climb.
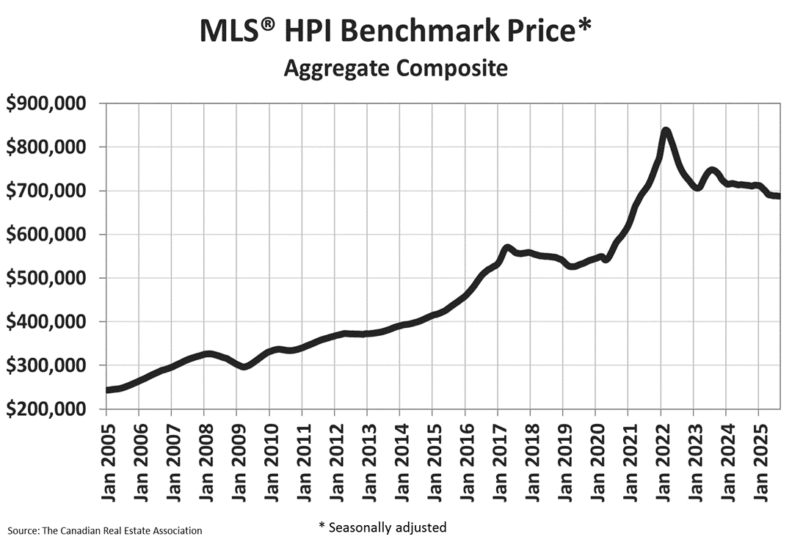
Chart showing the MLS® Home Price Index. Source: The Canadian Real Estate Association (CREA)
The View from Saint John
While this report focuses on national data, the trends often signal what’s ahead for local markets like ours in Saint John. An increase in national sales and market confidence can influence buying and selling decisions right here at home. With more listings appearing after Labour Day, the fall market could become more active.
“Now that we are on the other side of Labour Day, new listings are flooding onto the market,” stated Valérie Paquin, CREA Chair. For anyone considering a move, she advises, “reach out to a REALTOR® in your area today.” This is the best way to understand how these national trends apply specifically to your neighbourhood in Saint John.
Frequently Asked Questions
Are Canadian home prices going up or down?
Nationally, prices are mixed. The MLS® Home Price Index shows prices are down 3.4% compared to a year ago but were almost flat from July to August. The national average sale price, however, rose 1.8% year-over-year to $664,078.
Is now a good time to buy a home in Canada?
The market is showing signs of heating up, with five straight months of sales growth. Nationally, conditions are considered balanced, meaning there isn’t excessive pressure favouring either buyers or sellers. Increased listings for the fall could provide more options for buyers.
What does ‘months of inventory’ mean for the housing market?
‘Months of inventory’ indicates how long it would take to sell all the homes currently for sale at the current sales pace. At 4.4 months, the national inventory is below the long-term average of five months, suggesting that homes are selling at a healthy pace.


0 Comments