The New Brunswick real estate market started 2026 with a whimper, but Saint John bucked the downward trend seen in other major hubs. While provincial sales dipped below historical averages, activity in the Port City remained unchanged compared to last year.
According to the latest data from the New Brunswick Real Estate Board, provincial home sales dropped 3% in January. However, Saint John held its ground, recording 96 sales matching the activity levels from January 2025 exactly.
Saint John Outperforms Moncton and Fredericton
While Saint John buyers kept the market steady, other regions saw a pullback. Greater Moncton recorded a 2.2% decline in sales, and Fredericton saw a sharper drop of 9.6%. This stability in Saint John suggests a resilience in the local market despite broader economic factors slowing down activity elsewhere.
The average price of a home sold in Saint John in January sat at $338,294, which represents a 1.3% increase from the previous year, contributing to a total dollar volume of over $32.4 million for the month. The median price in the area also saw healthy growth, rising 6.1% to $328,000.
Saint John Property Types Breakdown
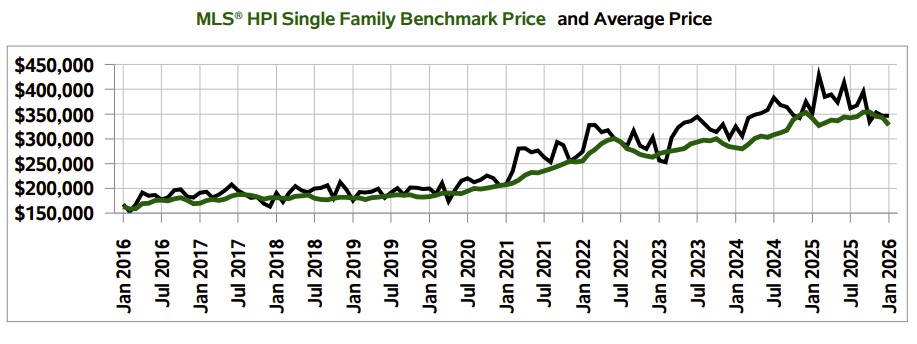
Photo from CREA Saint John and Area Residential Market Activity and MLS® Home Price Index Report January 2026
- Single-Family Homes: Sales activity reached 77 units, up 1.3% from January 2025. The average price for single-family homes was $346,895, while the median price grew 3.4% to $338,750.
- Apartments: The apartment segment saw 4 sales in January, an increase of 33.3% year-over-year. The average price for an apartment jumped significantly by 63.0% to $292,825.
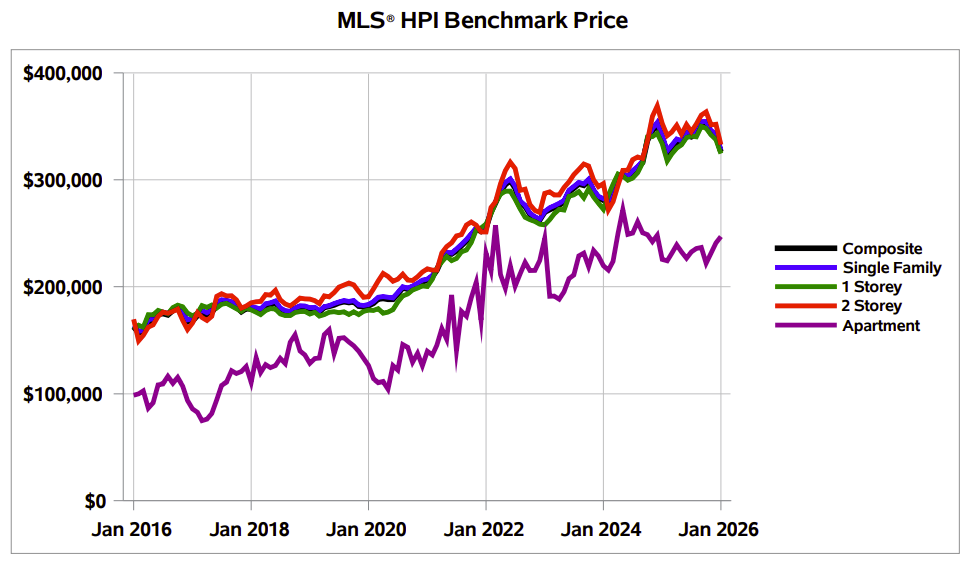
Photo from CREA Saint John and Area Residential Market Activity and MLS® Home Price Index Report January 2026
Provincial Prices and Local Inventory
Across New Brunswick, the MLS® Composite Benchmark Price reached $329,400, a 4.8% increase from the previous year. However, prices are shifting differently depending on the property type:
- Single-family homes: Up 5% to $330,400.
- Townhouse/row units: Up 7.6% to $246,400.
- Apartments: Down 3.8% to $289,700.
Justin Morehouse, Chair of the New Brunswick Real Estate Board, noted that sales came in below typical expectations for this time of year. “The MLS® Composite Benchmark Price edged down to its lowest point since the end of summer 2025, in part due to softer apartment prices,” Morehouse stated. “Even with that month-to-month dip, benchmark pricing remained higher than at the end of January last year.”
Inventory Levels Rising
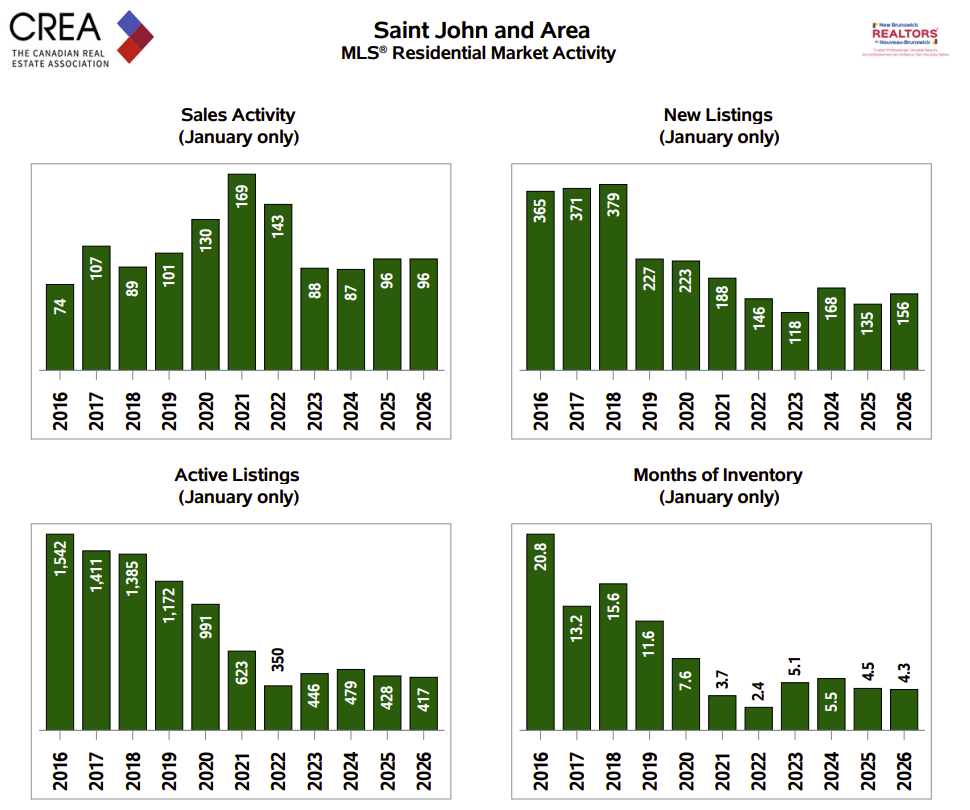
Photo from CREA Saint John and Area Residential Market Activity and MLS® Home Price Index Report January 2026
For buyers frustrated by a lack of options, the market shows signs of easing. Provincially, the number of months of inventory, a measure of how long it would take to sell all current listings at the current sales rate, rose to 5.5 months. While this is still below the long-run average of 7.4 months, it indicates a move toward more balanced conditions.
In Saint John specifically, the market is moving slightly faster. The months of inventory for Saint John was 4.3 in January 2026, down slightly from 4.5 in January 2025. While active listings in Saint John dropped 2.6% to 417, new listings saw a healthy surge of 15.6%, with 156 properties hitting the market.
Frequently Asked Questions
How does the Saint John market compare to the rest of the province?
While the province saw a 3% decrease in sales overall, Saint John sales remained flat (unchanged) compared to January 2025, recording 96 sales and outperforming Fredericton and Moncton.
What is the average home price in Saint John?
For January 2026, the average price of a home sold in Saint John was $338,294, with single-family homes slightly higher at $346,895.
Are home prices in New Brunswick dropping?
Year-over-year, the provincial benchmark price is up 4.8%. However, prices have dipped slightly month-over-month since the end of summer 2025, specifically in the apartment segment.
0 Comments